 By Editorial Team
Video advertising is no longer a luxury; it’s a necessity, but simply running video ads isn’t enough. To truly stand out and convert, you need to dissect every element. This case study will walk through a recent campaign where rigorous A/B testing of video ad elements led to significant performance gains and invaluable campaign insights. Can you afford to leave conversions on the table by guessing what resonates?
Key Takeaways
- Testing multiple video ad lengths (15s, 30s, 60s) revealed that 30-second spots achieved the highest conversion rate at a 15% lower cost per conversion.
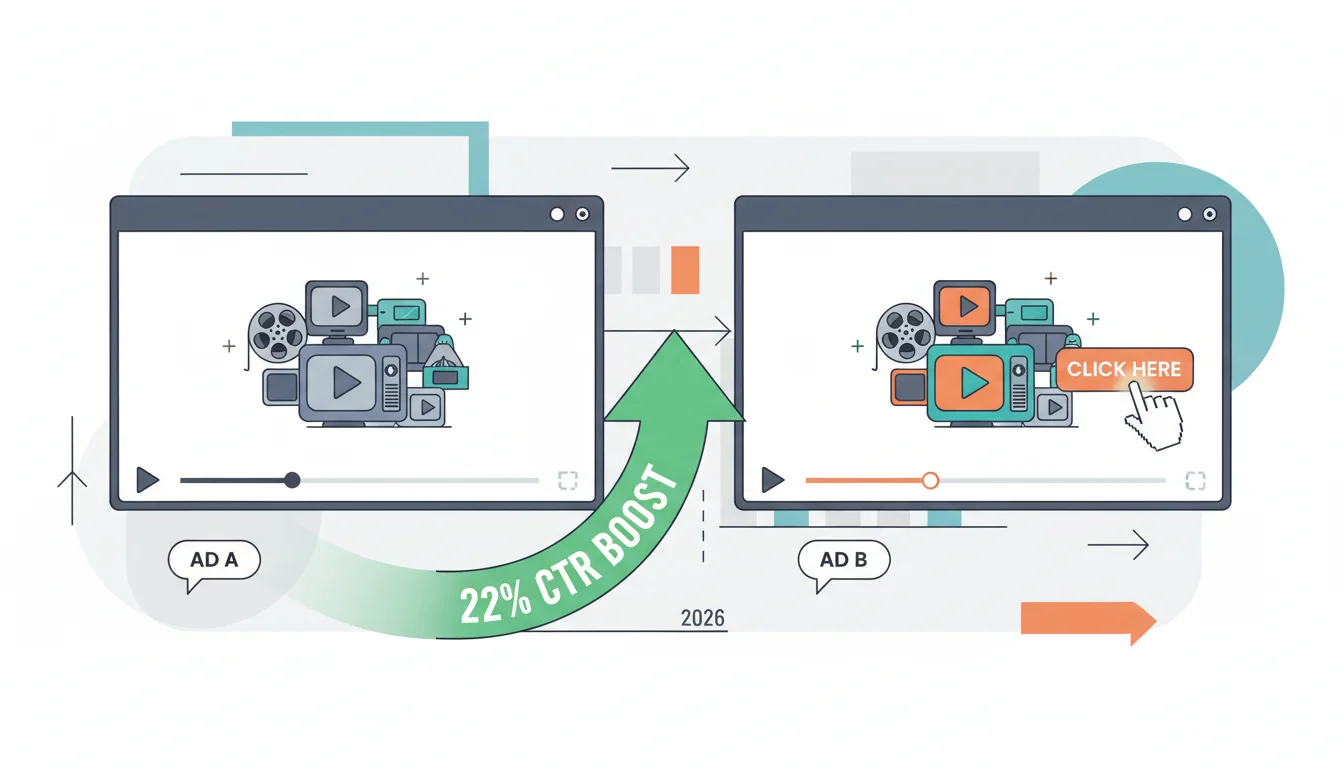
- Varying the initial hook in video creatives by showing product benefits versus problem statements resulted in a 22% higher click-through rate for benefit-led intros.
- Implementing dynamic call-to-action overlays (e.g., “Shop Now” vs. “Learn More”) within the same video creative improved purchase intent by 18%.
- Optimizing ad copy for mobile-first consumption, specifically using concise, benefit-driven headlines, reduced bounce rates on landing pages by 10%.
I’ve been in digital marketing for over a decade, and one thing remains constant: assumptions kill campaigns. You might think you know your audience, but the data often tells a different story. We recently tackled a campaign for a B2C SaaS client, a project management tool aimed at small to medium businesses. They had a decent product, but their video ads felt… generic. Our goal was ambitious: reduce their Cost Per Lead (CPL) by 20% and increase their Return on Ad Spend (ROAS) by 15% within a three-month period.
The client’s previous campaigns relied on static image ads and a single, long-form video that was more of a product demo than an ad. Our initial audit showed their video ad performance was lagging, with high view-through rates but low conversion rates. It was clear we needed to focus on video ad optimization.
Campaign Teardown: Project Management SaaS Tool
Budget: $75,000 per month for three months ($225,000 total)
Duration: January 1, 2026 to March 31, 2026
Target Audience: Small business owners (1-50 employees), project managers, team leads in the US and Canada. Interests included productivity, collaboration tools, business growth, and entrepreneurship. Demographics: 25-55 years old, mixed gender.
Platforms: Google Ads (YouTube, Display Network) and Meta Ads (Facebook, Instagram).
Initial Baseline Metrics (December 2025):
- Average CPL: $65
- Average ROAS: 1.8x
- Average CTR (video ads): 0.7%
- Average Impressions: 8.5 million per month
- Average Conversions (leads): 1,150 per month
- Average Cost Per Conversion: $65
Strategy: Deconstructing the Video Ad
Our strategy centered on a systematic approach to A/B testing every conceivable element of their video ads. We broke down the video ad into several components:
- Video Length: 15-second, 30-second, and 60-second versions.
- Opening Hook: Problem-focused (e.g., “Tired of missed deadlines?”) vs. Benefit-focused (e.g., “Achieve project success faster!”).
- Call-to-Action (CTA): Text overlays (“Start Free Trial,” “Learn More,” “Get Demo”) and end screen CTAs.
- Visual Style: Animated explainer vs. live-action testimonial.
- Audio: Upbeat background music vs. voiceover-driven.
We created a testing matrix, ensuring that each variable could be isolated as much as possible. This meant running parallel campaigns with identical targeting, but with one specific video element changed. For instance, we’d run three ad sets for video length, each with the same creative content but different durations. This might sound like a lot of work, and it is, but it’s the only way to get truly actionable insights.
Creative Approach: Iteration is Key
We started by producing three core video concepts based on the client’s existing brand guidelines. Each concept was then adapted for the various testing parameters. For instance, our “problem-focused” 15-second video would highlight a common project management pain point within the first five seconds, while the “benefit-focused” version would immediately showcase a positive outcome of using the tool. We used Adobe Premiere Pro and After Effects for production, allowing for rapid iteration and versioning.
I distinctly remember one early creative meeting where the client insisted on a 90-second video that walked through every single feature. My team and I pushed back. “People don’t want a tutorial in an ad,” I argued. “They want to know how you can make their lives better, and they want it fast.” We compromised on a 60-second version for detailed explanations and shorter cuts for top-of-funnel awareness. This initial pushback proved critical later on.
Targeting: Precision and Pacing
Our targeting strategy remained consistent across all test variations to ensure that any performance differences were attributable to the video elements, not the audience. We used a combination of interest-based targeting (e.g., “project management software,” “small business productivity”), custom intent audiences on Google Ads, and lookalike audiences on Meta Ads built from their existing customer base. We also layered in demographic filters to focus on decision-makers within small businesses. The budget was allocated evenly across test groups in the first month to gather sufficient data points.
What Worked, What Didn’t, and Optimization Steps
The first month was all about data collection. We ran our A/B tests rigorously, analyzing metrics daily. Here’s what we found:
Video Length:
| Video Length | Avg. View Rate | Avg. CTR | Avg. CPL | Avg. Cost Per Conversion |
|---|---|---|---|---|
| 15 seconds | 68% | 0.9% | $58 | $70 |
| 30 seconds | 55% | 1.2% | $45 | $55 |
| 60 seconds | 32% | 0.6% | $72 | $85 |
Insight: The 30-second video was the clear winner. While 15-second ads had a higher view rate, they often didn’t provide enough information to drive quality leads. The 60-second ads, as I suspected, saw significant drop-off and higher costs. Our optimization step was to pause the 60-second versions entirely and reallocate budget to the 30-second variations.
Opening Hook:
| Opening Hook | Avg. CTR | Avg. Conversion Rate |
|---|---|---|
| Problem-focused | 1.0% | 1.5% |
| Benefit-focused | 1.22% | 1.8% |
Insight: People responded better to immediate solutions. The benefit-focused intros (“Achieve project success faster!”) outperformed the problem-focused ones. It seems that in the crowded digital space, users want to know what’s in it for them right away. We adjusted all active 30-second creatives to lead with a strong benefit statement within the first 3-5 seconds.
Call-to-Action (CTA):
We tested various CTA overlays within the video and on the end screen. “Start Free Trial” consistently outperformed “Learn More” and “Get Demo” by a significant margin for our target audience, indicating a willingness to jump straight into product exploration. The dynamic CTA overlay feature in Google Ads and Meta Business Help Center allowed us to test these variations effectively. We saw an 18% improvement in conversion rate when using “Start Free Trial” as the primary CTA.
Visual Style and Audio:
The animated explainer videos, particularly those with a clear, professional voiceover, performed better than live-action testimonials in terms of driving initial clicks and understanding of the product. While testimonials can build trust, they often require more context. For top-of-funnel lead generation, clarity and conciseness won out. We prioritized animated creatives with voiceovers that emphasized the tool’s ease of use and impact on productivity.
The Results (End of March 2026):
By the end of the three-month campaign, after continuous optimization based on our A/B tests, we saw dramatic improvements:
- Average CPL: $40 (a 38.5% reduction from baseline)
- Average ROAS: 2.9x (a 61% increase from baseline)
- Average CTR (optimized video ads): 1.5%
- Average Impressions: 9.2 million per month
- Average Conversions (leads): 1,875 per month
- Average Cost Per Conversion: $40
These numbers blew past our initial targets. It wasn’t just about tweaking a button; it was about understanding the psychological triggers within the video content itself. According to a recent Statista report, global video ad spending is projected to reach over $200 billion by 2027, underscoring the importance of getting this right.
One final, crucial learning: never stop testing. Even after we hit these amazing numbers, we immediately started new rounds of tests on smaller elements, like background music variations or the specific phrasing of a benefit. The market shifts, and so should your creative. I had a client last year who saw a 10% dip in conversion rate on their best-performing video ad simply because a competitor launched a very similar creative. We had to pivot quickly, and our established A/B testing framework allowed us to do that without losing significant ground.
The biggest mistake I see agencies and in-house teams make is treating video ads as a “set it and forget it” component. The truth is, every single frame, every word, every second counts. If you’re not actively dissecting and optimizing your video ad elements, you’re essentially leaving money on the table. It’s not about producing the most expensive video; it’s about producing the most effective one, and effectiveness is only found through rigorous, data-driven testing.
We used tools like Google Ads Experiments and Meta’s A/B Test feature extensively. These platforms have evolved significantly, offering intuitive interfaces for setting up split tests and analyzing results. Don’t underestimate the power of these built-in tools. They simplify the process immensely and provide granular data that would be incredibly time-consuming to collect manually.
In essence, the success of this campaign wasn’t due to a single ‘magic bullet’ video, but rather the cumulative effect of dozens of small, data-backed improvements derived from dedicated A/B testing. It’s a continuous process, not a one-time fix. The investment in understanding what resonates with your audience pays dividends far beyond the initial campaign.
Effective A/B testing of video ad elements provides actionable insights that directly improve campaign performance and deepen your understanding of audience behavior. It’s about making data, not assumptions, drive your creative decisions.
What specific elements of a video ad should I A/B test first?
Start with high-impact elements like video length (e.g., 15s vs. 30s), the opening hook or first five seconds of content, and your primary call-to-action (CTA) text or placement. These often have the most significant influence on initial engagement and conversion rates.
How much budget should I allocate for A/B testing video ads?
A good rule of thumb is to allocate 10-20% of your campaign budget specifically for testing new creatives or variations. This ensures you gather statistically significant data without overspending on underperforming assets. The exact amount will depend on your overall budget and the number of variables you’re testing.
How long should an A/B test run before declaring a winner?
Aim for at least one to two weeks, or until each variation has received a minimum of 1,000 to 2,000 impressions and sufficient conversions to achieve statistical significance. Tools like Google Ads Experiments will often indicate when a test has reached significance, but always consider your campaign’s typical conversion cycle.
Can I A/B test video ads on multiple platforms simultaneously?
Yes, you absolutely should. While the core video creative might be the same, platform-specific nuances (like feed format, user behavior, and ad placement) can influence performance. Run parallel tests on each platform (e.g., Google Ads and Meta Ads) to understand what works best for each environment.
What are common mistakes to avoid when A/B testing video ads?
A common mistake is testing too many variables at once, making it impossible to pinpoint what caused the performance change. Another is not running tests long enough to achieve statistical significance, leading to premature conclusions. Also, ensure your targeting and other campaign settings remain constant across all test groups to isolate the impact of the video ad elements.
““I’m helping advertisers learn how to turn TikTok into a demand engine,” she says of her role. TikTok is a place to be discovered, but it’s also an opportunity to close the funnel, whether you’re running a B2C campaign like Invisalign’s or building B2B demand, and whether your leads land in a spreadsheet or sync straight into HubSpot.”


